
Learning and research planning
Short explanations of study design and statistical tests, and a planner that turns a research question into objectives, a design and the variables to record.
Solutions and products
Chavery builds its own products as well as solutions for others. They show how we think: start from the process people actually follow, and design the system around it.
Featured product
Technology designed around the research process—not just another collection of disconnected tools.
A research technology platform for postgraduate researchers, their guides and their institutions. It supports the research journey from the first question to the finished document, in one place, so nothing is retyped and nothing is copied between files by hand.
Chavery Research Companion is available now as a web application. Planning, the master chart and data entry are free; the analysis and the finished document are paid, per research project. Institutions begin with a three-month pilot.
The application runs separately from this website, at app.chavery.in. This site explains Chavery; the application is where the work happens.
The research journey
In the product
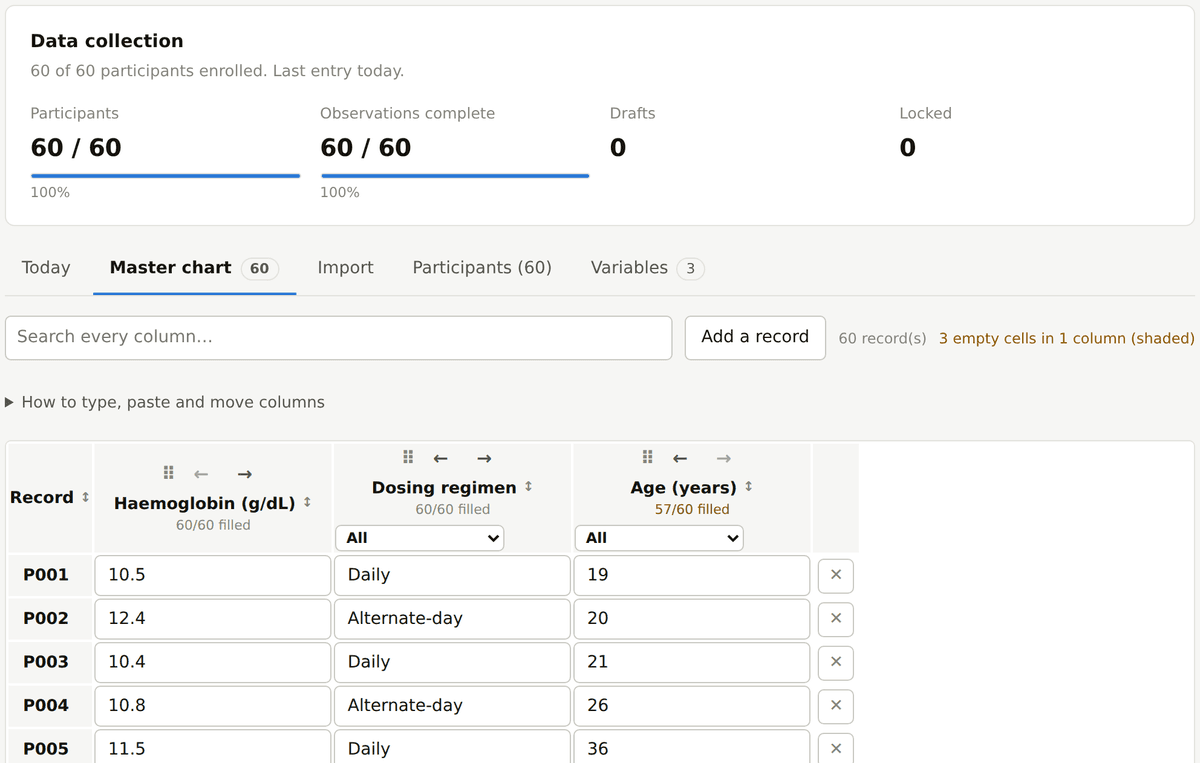
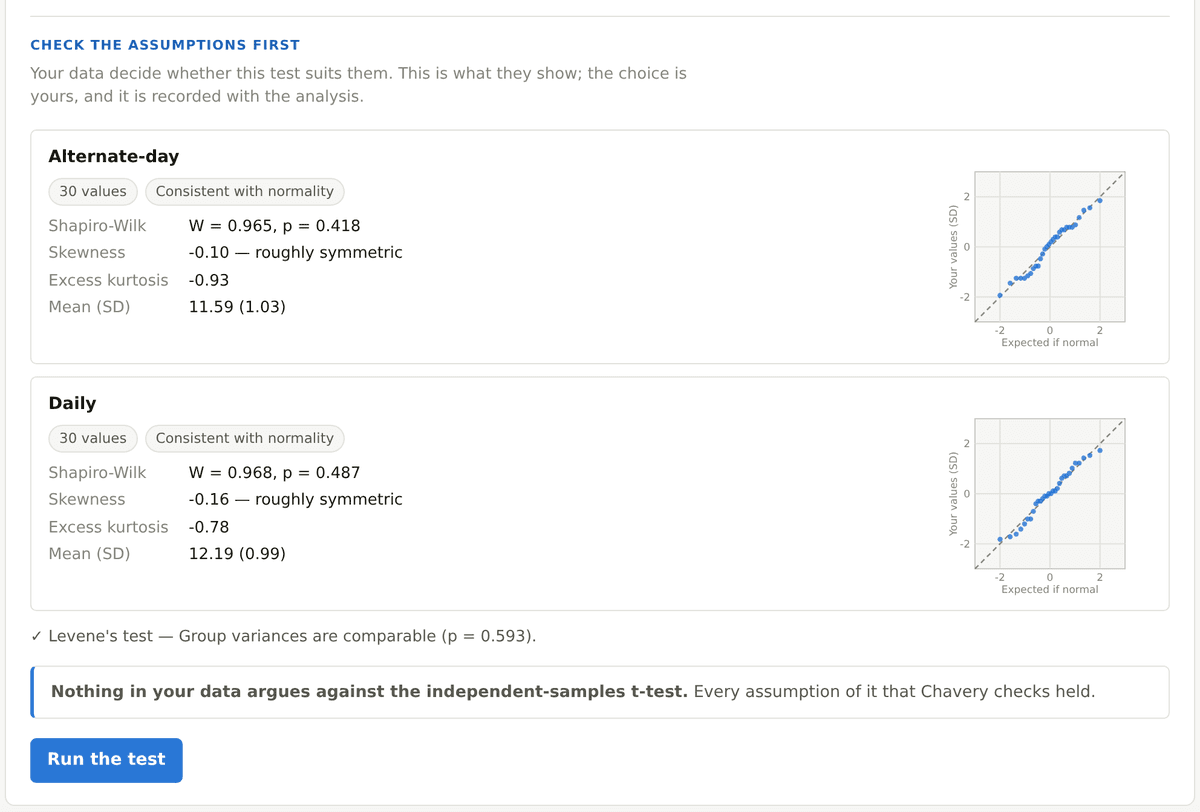
Two screens from the running application. The data is synthetic: a fictional study with invented participants, entered for demonstration. No real participant or researcher is shown.
A design decision
Chavery Research Companion does not use generative AI. Every number, recommendation and reported sentence comes from a formula or a written rule, the same input gives the same output, and research data is not sent to an external AI service. That is a design decision for a product whose output is examined; it is not a limit on what Chavery builds for clients.
The pages below describe Chavery Research Companion in detail and carry the policies that apply to it.
Have a different problem?
Discuss Your ChallengeResearch Companion is one answer to one problem. If yours is different, we start by understanding it.